



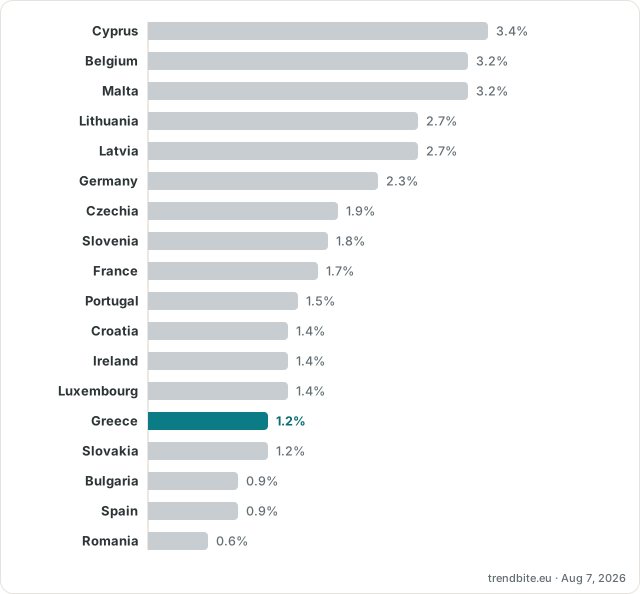
This table compares job vacancy rates across European countries, showing how hard it is for employers to fill open posts. The figures come from Eurostat's quarterly job vacancy statistics. Each row shows the vacancy rate alongside the underlying counts of vacant and occupied posts.
In the fourth quarter of 2025, Cyprus had the highest job vacancy rate in the EU at 3.4%, and Romania the lowest at 0.6% — a gap of 2.8 percentage points.
Embed on your page
Applies to interactive views; the image keeps the brand colour.
| # | Job vacancy rate | Job vacancies | Occupied posts | |
|---|---|---|---|---|
| 1 | Cyprus | 3.4% | 11,294 | 318,913 |
| 2 | Belgium | 3.2% | 117,857 | 3,535,791 |
| 3 | Malta | 3.2% | 7,849 | 237,974 |
| 4 | Lithuania | 2.7% | 31,637 | 1,158,160 |
| 5 | Latvia | 2.7% | 19,272 | 705,795 |
| 6 | Germany | 2.3% | 878,581 | 36,931,083 |
| 7 | Czechia | 1.9% | 68,757 | 3,532,921 |
| 8 | Slovenia | 1.8% | 11,642 | 650,832 |
| 9 | France | 1.7% | 275,948 | 15,664,465 |
| 10 | Portugal | 1.5% | 47,786 | 3,157,725 |
| 11 | Croatia | 1.4% | 15,294 | 1,108,310 |
| 12 | Ireland | 1.4% | 30,300 | 2,087,900 |
| 13 | Luxembourg | 1.4% | 6,416 | 446,123 |
| 14 | Greece | 1.2% | 25,821 | 2,113,706 |
| 15 | Slovakia | 1.2% | 16,677 | 1,365,943 |
| 16 | Bulgaria | 0.9% | 17,432 | 1,958,520 |
| 17 | Spain | 0.9% | 131,282 | 13,869,687 |
| 18 | Romania | 0.6% | 28,733 | 4,644,892 |
Methodology
Figures come from Eurostat's quarterly job vacancy statistics (dataset jvs_q_nace2), reference quarter Q4 2025 (as of 31 December 2025). The job vacancy rate is the number of vacancies divided by the sum of vacancies and occupied posts. The vacancy and occupied-post counts are absolute numbers of posts, not thousands. Values for Bulgaria, Spain, Romania, Ireland, Latvia and Malta are provisional (Eurostat flag p); the figures for France use a definition that differs from the standard (Eurostat flag d). No currency conversion applies to this dataset.
Sources
- Bulgaria (): ec.europa.eu
- Czechia (): ec.europa.eu
- Spain (): ec.europa.eu
- Greece (): ec.europa.eu
- Croatia (): ec.europa.eu
- Romania (): ec.europa.eu
- Slovenia (): ec.europa.eu
- Slovakia (): ec.europa.eu
- Belgium (): ec.europa.eu
- Cyprus (): ec.europa.eu
- Germany (): ec.europa.eu
- France (): ec.europa.eu
- Ireland (): ec.europa.eu
- Lithuania (): ec.europa.eu
- Luxembourg (): ec.europa.eu
- Latvia (): ec.europa.eu
- Malta (): ec.europa.eu
- Portugal (): ec.europa.eu