


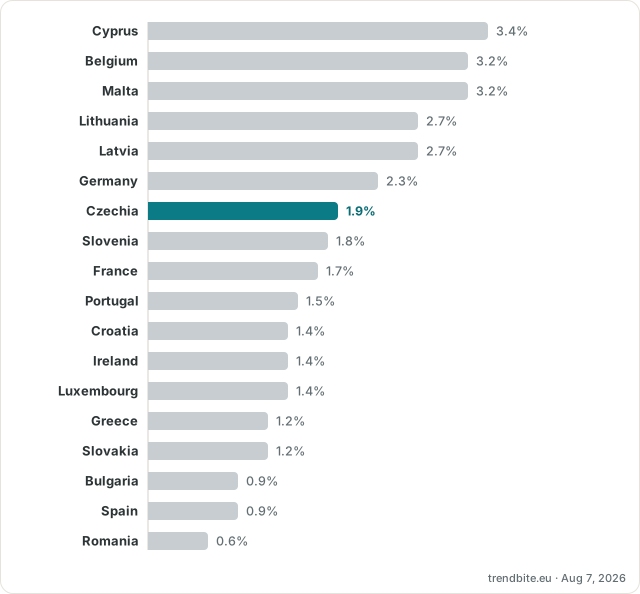
The table compares the job vacancy rate in EU countries, i.e. vacant posts as a share of all posts, filled and vacant, a common gauge of labour-market tightness. All figures come from Eurostat's quarterly job vacancy statistics; each row shows its own reference quarter.
In the quarter ending 30 June 2026, Cyprus had the highest job vacancy rate in the table (3.1%) and Romania the lowest (0.6%, provisional), a gap of 2.5 percentage points.
Embed on your page
Applies to interactive views; the image keeps the brand colour.
| # | Job vacancy rate | |
|---|---|---|
| 1 | Cyprus | 3.1% |
| 2 | Belgium | 3% |
| 3 | Malta | 2.5% |
| 4 | Germany | 2.3% |
| 5 | Hungary | 2.3% |
| 6 | Denmark | 2.2% |
| 7 | Slovenia | 2% |
| 8 | France | 1.6% |
| 9 | Croatia | 1.3% |
| 10 | Ireland | 1.3% |
| 11 | Italy | 1.3% |
| 12 | Luxembourg | 1.3% |
| 13 | Greece | 1.2% |
| 14 | Slovakia | 1.2% |
| 15 | Bulgaria | 0.9% |
| 16 | Spain | 0.9% |
| 17 | Romania | 0.6% |
Methodology
Figures come from Eurostat's quarterly job vacancy statistics (dataset jvs_q_r21, linked on every row). The job vacancy rate is the number of vacancies divided by the sum of vacancies and occupied posts. Each row's date is the last day of its reference quarter; countries appear only where Eurostat has published the rate for the latest quarter. Eurostat marks the figures for Bulgaria, Spain, Romania, Hungary, Ireland and Malta as provisional (they may still be revised), and notes a differing definition for France, Italy and Denmark, so compare those with care.
Sources
- Cyprus (): ec.europa.eu
- Belgium (): ec.europa.eu
- Malta (): ec.europa.eu
- Germany (): ec.europa.eu
- Hungary (): ec.europa.eu
- Denmark (): ec.europa.eu
- Slovenia (): ec.europa.eu
- France (): ec.europa.eu
- Croatia (): ec.europa.eu
- Ireland (): ec.europa.eu
- Italy (): ec.europa.eu
- Luxembourg (): ec.europa.eu
- Greece (): ec.europa.eu
- Slovakia (): ec.europa.eu
- Bulgaria (): ec.europa.eu
- Spain (): ec.europa.eu
- Romania (): ec.europa.eu